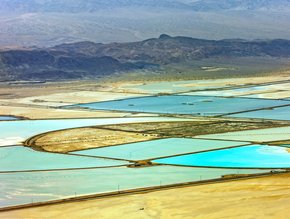
Mining for data: Using advanced graphing software to mitigate safety risks
When sections in underground mines are overstressed and pose hazardous conditions, there is a great deal at stake in terms of equipment, time and most importantly lives. Specialized numerical modeling tools have been developed over the years to predict stability and estimate stresses during the routine excavation of coal, simplifying the representational data extracted from the abundant variables measured.
• Related content: Rio Tinto goes solar at Weipa mine in Australia
Mining engineers turn to four possible numerical modeling tools for analyzing stress: an empirical model that underlies the Analysis of Longwall Pillar Stability (ALPS) program; the three-dimensional displacement discontinuity program MULSIM/NL; the three-dimensional flexible overburden program LaModel; and the two-dimensional volume-element program FLAC.
Each of these tools has underlying assumptions that affect their calculated results, which may or may not be calibrated correctly to the current site. To determine which model most closely follows the actual stresses in the mine, engineers analyze the difference between real-life conditions and the calculated results of these models. Advanced graphing software equips mining engineers with tools needed to collect measurements from the mine and the resulting calculations, in order to present them in detailed, insightful graphs for proper analysis of the various numerical models.
Data Collection

Collecting a high volume of measurements is necessary to provide an accurate gauge of mining behavior and to calibrate numerical models adequately. However, the millions of points of calculated data produced from these modeling tools are staggering. In most cases, the output will not fit on a single sheet of a spreadsheet. Extraction of certain stress or displacement profiles from the spreadsheet requires exhaustive periods of time considering the thousands of models that are necessary. Additionally, the contouring capabilities of spreadsheets are poor, at best, or nonexistent.
In its place, data analysis and graphing software helps to collect calculated results from the models and measurements of stress, displacement, and load from the mine. Using scripting language for programming the analysis and graphing of data, mining engineers can then automate data import and extraction. This eliminates the time consuming task of manual data entry and the inevitable inaccuracies from human errors, which could have disastrous implications.
• Related content: Nevada will soon play a major role in supplying lithium to Tesla
With advanced graphing capabilities, engineers can easily compare model output with measurements to determine whether a model was adequately calibrated. In addition, graphing software aids researchers to determine the appropriate constitutive laws or material strength models to use. A visual comparison of the calculated results from each model can clearly present conclusions as to which model most closely followed the measured mine activity.
Visualization

Importing such an abundance of data can make it difficult to uncover any insight, much less make a deductive conclusion by solely looking at the data presented in spreadsheets. This is why comprehensive, variable-style visualization is necessary.
Looking specifically at the LaModel and MULSIM/NL models, diagram 1A examines Borehole Pressure Cell (BPC) measurements and makes comparisons between the measured and calculated load transfer distances. The measured results are plotted in line and symbol graphs against the numerical models. The similarity between the measured curve and the calculated MULSIM/NL elastic curve indicate that the MULSIM/NL elastic 60 percent to 80 percent coal model is more accurate than the LaModel and MULSIM/NL 900-psi models. This would not be easily discovered by only looking at spreadsheets of data. Only when plotted on this easy-to-follow graph is it clear which numerical model most closely represented the actual mining process.

(Diagram 1A)
Presentation
The manner in which research is presented can positively or negatively alter the perception of its validity. This is especially true when sharing work in journals and speaking at industry events. Researchers often think that basic graphing applications are adequate enough to fulfill their presentation needs. However, the resulting graphs tend to be quite simple and lack the flexibility necessary to properly express the true insight of the data.
Diagram 1A depicts the distribution of stress increase with respect to the pre-panel phase of a longwall mining panel from the American west, with an instrument line noted in pink and the calculated MULSIM/NL model stress increase displayed in contours. This mining step shows the average location of the face when the instruments detected the stress increase reading of 20 psi. When comparing the MULSIM/NL model with actual measurements, the stress increase contour line approximately meets the location of the instruments, indicating that the rock mass stiffness for the MULSIM/NL model is calibrated in line with the measured stress profiles. Ultimately, professional presentations like this contour graph increase the credibility of the research it is displaying, and help mining project managers correctly calibrate numerical models.

Th graph was developed and provided by the National Institute for Occupational Safety and Health (NIOSH).
The ultimate goal of this type of research is to better understand how to predict impending danger and what to do about it. Numerical models are only sufficient if they follow the rock mechanics of the mine. The insight extracted from these data and graphs help in calibrating the numerical tools and determining their limitations. Calibrating basic modeling parameters to in-mine measurements and determining basic material models of the coal present significant steps toward mitigating mining-induced hazards.
• Related content: Mining equipment + Internet of Things
The data collection, visualization and analysis provided by advanced graphing software will unquestionably be instrumental in future research to identify other geologic structural conditions that contribute to mining-induced, sudden release of seismic energy. Mining engineers tasked with safe excavation must ensure the proper model is chosen for the particular section of underground mine and create a viable, valid and informative model, which permits them to do so.
With a site-specific, calibrated model, engineers can accurately anticipate impending collapses and prevent catastrophes that endanger mine workers, equipment and production. Mining remains a dangerous job, but proper work by mining engineers will lessen the inherent risk and create a safer environment.
Stay connected! Follow us on Twitter and like us on Facebook
- Brightstar, Eldridge and Claure acquire AusencoSupply Chain & Operations
- First Quantum contracts with MECS to cut emissionsSupply Chain & Operations
- Tin production at Andrada Mining reaches record levelsSupply Chain & Operations
- Ternium plans to build US$3.2bn steel plant in MexicoSupply Chain & Operations